ChiSky Flight Tracker

Lucas Ferguson
—Feb 14, 2024
ChiSky Flight Tracker: Visualizing Flight Data
I'm thrilled to share a project developed with a team of four as part of our CS425 course, which combines many technologies to analyses and visualize flight data. This web application uses React, Next.js, PostgreSQL, and deck.gl to deliver a dynamic and interactive experience.
Links:
- Frontend Demo: https://chisky.vercel.app/
Project Overview
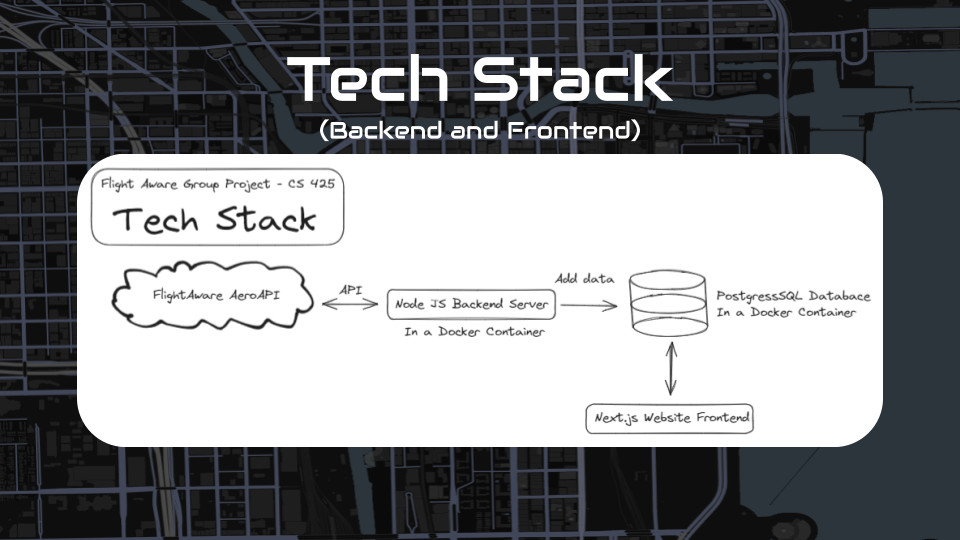
The project centers on fetching real-time flight data from FlightAware and storing it in a local PostgreSQL database. This setup ensures efficient data retrieval and manipulation, allowing users to perform many queries while limiting the number of API requests needed. The below tech stack diagram illustrates how these technologies are integrated, providing a clear overview of the application's architecture.

FlightAware AeroAPI
FlightAware offers an API called AeroAPI, which provides access to flight data. The pricing for this API is based on the number of queries made. As of writing this article, the cost per query is about $0.002, depending on the volume of queries.
Local Data Retrieval with Raspberry Pi
To contribute to the FlightAware Network and reduce our API costs, we set up a Raspberry Pi with an antenna attached to my window. This allowed us to locally retrieve flight data from around campus and share it with FlightAware.
Setup: We installed the FlightAware software on the Raspberry Pi, and connected a SDR (Software-Defined Radio) to capture data. Although the data was limited due to the lack of a filter tuned for ADS-B signals this setup achieved our goals.
Front-End with React and Next.js
React was chosen for the front end to create a responsive and interactive user interface. Its component-based architecture enabled us to build a seamless navigation experience and ensure fast data updates.
Data Management with PostgreSQL
PostgreSQL proved to be an excellent choice for handling complex queries and frequent data updates. The `UPSERT` SQL command was particularly useful for managing data integrity during insertions.
3D Visualization with deck.gl
The standout feature of this project is the use of deck.gl to render airplanes on a 3D map of the world. This powerful WebGL-based visualization library provides a captivating way to explore global flight paths and movements, offering high-performance rendering of large datasets.
Lessons Learned
- The `UPSERT` SQL command is invaluable for data management.
- PostgreSQL is a robust choice for databases requiring frequent updates and complex queries.
- Changing Database table specifications is fairly difficult after backend code has been developed.
Meet the Team
This project was a collaborative effort involving four team members, each contributing unique skills and expertise to bring this project to life.
- Lucas Ferguson
- Accelerated BS+MS in CS @ IIT
- Astrid Beasley
- Applied Math and CS major, Accelerated MS in AI
- Joseph Pancho
- 4th Year CS Undergraduate @ IIT
- Melissa Laiz
- 2nd Year Computer Science @ IIT